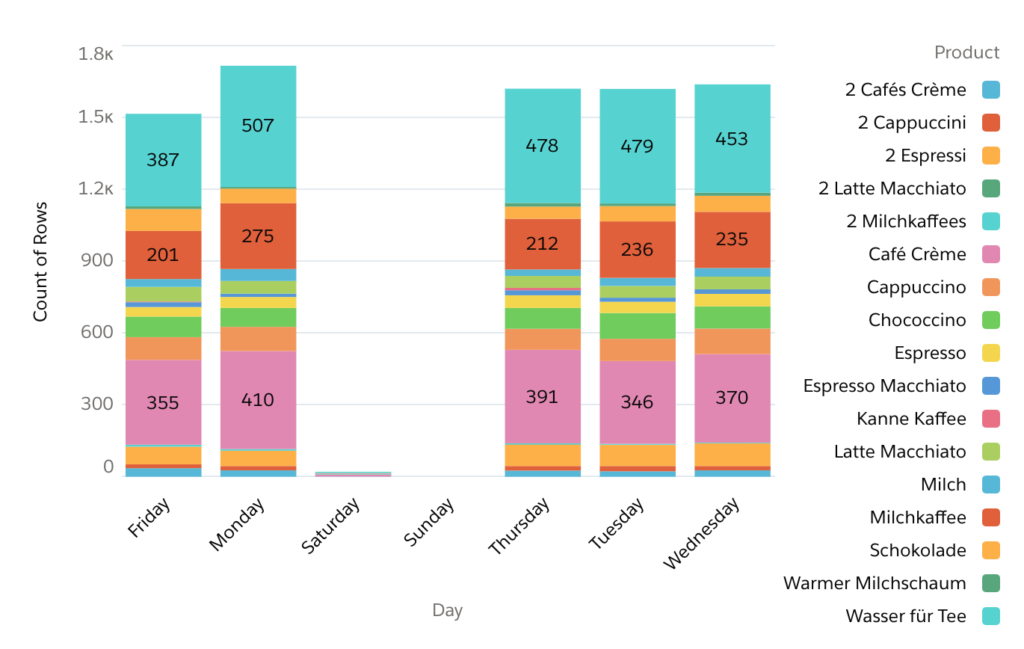
When I started with Einstein Analytics, I had little business data at hand and I wanted to build something that I could demo to customers in a way that allows them to understand what Einstein Analytics is capable of in a friendly and entertaining way, but without the need of showing our company’s data or fictitious data that people can or cannot relate to. It was just the same time that we got a new, professional coffee maker that can export machine data that gives details on the coffee consumption.
Well – a coffee dashboard! Now that’s something everyone knows: isn’t the coffee maker the number one social space in every company? Isn’t great coffee more than a perk, but rather a necessity of work in the 21st century?
Long story short: I have built this dashboard. I have maintained it for a while, and it always served its purpose very well. And Einstein Analytics moves more and more to the center of our business intelligence, requiring me to take better care of the assets we hold in Analytics and especially decluttering our org from time to time. I removed the old coffee dashboard to keep the org clean, and this could have been the end of the story…
… until I posted about my success in passing the Einstein Analytics and Discovery Consultant certification. I mentioned the coffee dashboard and people did ask for that. So I decided to rebuild it, as it is a good tutorial on how to leverage the features of Analytics to consume external data, run some preparation and build a fancy and fun dashboard. So – join me on this ride back to my Einstein Analytics roots in what was then Wave Analytics. I plan to blog about each step on bi- or triweekly basis.
