In the past blogpost, we have prepared and upload an XML export from our Franke A400 coffee machine. As we’re working with machine data, the data prep journey isn’t over yet. Let’s talk about how to find out what’s in the data, what’s left to be done, and how to resolve these issues.
One nasty thing about working with machine data is, while typically very clean and structured (because written out by a machine following predefined rules), it’s not designed to be read and understood by humans in the first place. In order to work with this data, we have to take a deeper look at the data loaded to analytics and try to get to the meaning of most of the relevant fields.

Let’s start by building a recipe. There are quite a number of helpful tools for our task in the Dataset Recipe. Switch to the “Column” view to see a list of column names and a status bar that indicates each column’s population with values. An important note of caution: Only a sample of the rows will be displayed, and the sample size is by default set to 5000. So before you decide on dropping some columns, make sure you reviewed the changed with a larger sample size or by exploring the dataset itself.
For the machine data we’re using, I know that there were relevant changes introduced with a newer software version, so I start by switching to the larger sample which is 10000 rows.
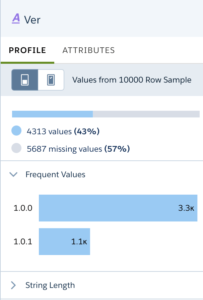
Let’s start by analyzing the first column. Its name is “Ver”, giving us a little clue about the purpose, but we need further investigation. Using the column profile, we can see that more than half of the rows doesn’t have data, and for the rest of the sample, there are only two values, which follow typical version naming conventions. It’s a software version, and “Ver” is obviously a lazy column name (or just an”efficient memory footprint”). Let’s switch to the “attributes” widget and change the label to “System Version”.
A few more columns have obvious content, “Ti” and “TiUtc” have both been identified as date fields, and the name hints already at the content. While “Ti” is populated everywhere, “TiUtc” seems to be filled only recently, and it contains redundant information as we’re only checking the data from a single machine in a single timezone. Ket’s change the label of “Ti” to “Datetime” and drop the representation of the date and time in UTC (“TiUtc”).
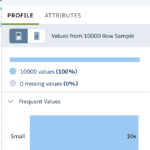
Next, let’s tackle two archenemies of any analytic approach. Columns with low variance in data, and columns that are there but empty. While low variance can happen and should be examined, no variance and no values are pointing at columns that are not relevant for analysis because they either have the same value for each row (so you don’t need an analysis to get to the value), or they contain nothing, so they are both predictable and without any value .
Going through the list of fields and looking at their value histograms, we can determine fo most of the fields if they are potentially useful for an analysis or not.
And there’s another we can find – let’s look at this histogram and the raw data and go into the details of what we can see here:

Did you find the potential issues:
- there’s a line “2 Espressi”. The issues is – quite obviously – that the quantity and the product are combined in one field. If we applied the Count(Rows) function, we’d end up with 2 (rows), not 3 (cups served). So one task in data prep is to split quantity and product name.
- Next: “Teewasser undosiert”. You won’t get to the core without translating the product name. It’s not a real issue, but a hint: The machine produces hot water (“Teewasser”) and the user can choose whatever quantity (“undosiert”). This is also available for hot milk, cold milk and steamed milk and will come very handy to understand the cryptically labeled telemetry fields later.
- “rinsing”: These are lines we typically want to filter, as the machine runs a lot of automated rinsing programs over the day and these are definitely not drinks consumed by the team.
- Did you see the last important issue by now? It’s “Latte Macchiato” vs. “Latte macchiato”
Handling the Data Prep in a Dataflow
I decided to handle these adjustments in a dataflow because I want to do a few things that are not currently available in Recipes (soon: Data Prep):
- I want to normalize the capitalization of the product names that’s different between firmware versions of the machine (that’s a replace function in Recipes and a ComputeExpression in Dataflow).
- I want to extract the quantities from single and double shots – this can be combined into a case formula which is available as a ComputeExpression in Dataflow
- I want to create canonical product names so that “2 Espressi” resolves to a user interaction (pushed “2 Espressi” button), a quantity (2) and a product (“Espresso”). Again, I’m going to use a ComputeExpression.
- … and some buckets for Tea, Coffee, Chocolate and Milk.
- Then, some transformations for the date – day, week number, month name, day name, hour as a dimension.
- And finally, we’re dropping all unused columns and auxilliary columns that were created in the process.
We end up with a data flow like this:
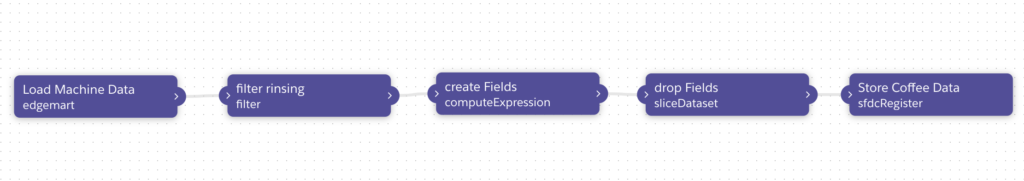
The complete JSON definition of this looks like this:
{
"filter rinsing": {
"action": "filter",
"parameters": {
"source": "Load Machine Data",
"saqlFilter": "'Na' != \"rinsing\""
}
},
"Store Coffee Data": {
"action": "sfdcRegister",
"parameters": {
"name": "Coffee Data",
"alias": "CoffeeData",
"source": "drop Fields"
}
},
"create Fields": {
"action": "computeExpression",
"parameters": {
"source": "filter rinsing",
"mergeWithSource": true,
"computedFields": [
{
"defaultValue": "0",
"precision": 2,
"name": "WeekNumber",
"saqlExpression": "Ti_Week",
"label": "Week Number",
"type": "Text"
},
{
"defaultValue": "0",
"precision": 1,
"saqlExpression": "day_in_week(toDate('Ti_sec_epoch'))",
"name": "DayInWeek",
"scale": 0,
"label": "Day In Week",
"type": "Numeric"
},
{
"defaultValue": "0",
"precision": 3,
"saqlExpression": "day_in_year(toDate('Ti_sec_epoch'))",
"name": "DayInYear",
"scale": 0,
"label": "Day In Year",
"type": "Numeric"
},
{
"defaultValue": "0",
"precision": 2,
"saqlExpression": "Ti_Hour",
"name": "Hour",
"label": "Hour",
"type": "Text"
},
{
"saqlExpression": "case \n Ti_Month\n when \"01\" then \"January\"\n when \"02\" then \"February\"\n when \"03\" then \"March\"\n when \"04\" then \"April\"\n when \"05\" then \"May\"\n when \"06\" then \"June\"\n when \"07\" then \"June\"\n when \"08\" then \"August\"\n when \"09\" then \"September\"\n when \"10\" then \"October\"\n when \"11\" then \"November\"\n when \"12\" then \"December\"\nelse \"\"\nend",
"name": "MonthName",
"label": "Month",
"type": "Text"
},
{
"name": "DayName",
"saqlExpression": "case \n DayInWeek\n when 1 then \"Sunday\"\n when 2 then \"Monday\"\n when 3 then \"Tuesday\"\n when 4 then \"Wednesday\"\n when 5 then \"Thursday\"\n when 6 then \"Friday\"\n when 7 then \"Saturday\"\nelse \"\"\nend",
"label": "Day",
"type": "Text"
},
{
"type": "Text",
"saqlExpression": "replace('Na',\"macchiato\",\"Macchiato\")",
"name": "Name",
"label": "Name"
},
{
"type": "Numeric",
"saqlExpression": "case when substr('Na',1,1) == \"2\" then 2\nelse 1\nend",
"name": "Quantity",
"label": "Quantity",
"precision": 1,
"defaultValue": "1",
"scale": 0
},
{
"type": "Text",
"saqlExpression": "case 'Na'\nwhen \"Teewasser undosiert\" then \"Tea\"\nwhen \"Milchschaum undosiert\" then \"Milk\"\nwhen \"Warme Milch undosiert\" then \"Milk\"\nwhen \"Kalte Milch undosiert\" then \"Milk\"\nwhen \"Schokolade\" then \"Chocolate\"\nelse \"Coffee\"\nend\n",
"name": "ProductType",
"label": "Product Type"
},
{
"type": "Text",
"name": "ProductName",
"label": "Product Name",
"saqlExpression": "case \n 'Name'\n when \"2 Cafés Crème\" then \"Café Crème\"\n when \"2 Cappuccini\" then \"Cappuccino\"\n when \"2 Espressi\" then \"Espresso\"\n when \"2 Latte Macchiato\" then \"Latte Macchiato\"\n when \"2 Milchkaffees\" then \"Milchkaffee\"\nelse 'Name'\nend"
}
]
}
},
"Load Machine Data": {
"action": "edgemart",
"parameters": {alias": "e_xportNew2"}
},
"drop Fields": {
"action": "sliceDataset",
"parameters": {
"mode": "select",
"fields": [
{"name": "WeekNumber"},
{"name": "Tl5"},
{"name": "Tl4"},
{"name": "Tl3"},
{"name": "Ti"},
{"name": "Tf"},
{"name": "Tb3"},
{"name": "Tb2"},
{"name": "Tb1"},
{"name": "Re"},
{"name": "Quantity},
{"name": "ProductType"},
{"name": "ProductName"},
{"name": "Pp"},
{"name": "Pl"},
{"name": "Ms"},
{"name": "MonthName"},
{"name": "Miv1"},
{"name": "Max"},
{"name": "Io"},
{"name": "Hour"},
{"name": "Fl"},
{"name": "Dd1"},
{"name": "DayName"},
{"name": "DayInYear"},
{"name": "DayInWeek"},
{"name": "Bt"},
{"name": "Bpt"},
{"name": "Bi2"},
{"name": "Bi1"},
{"name": "Bam"},
{ "name": "Name"}
],
"source": "create Fields"
}
}
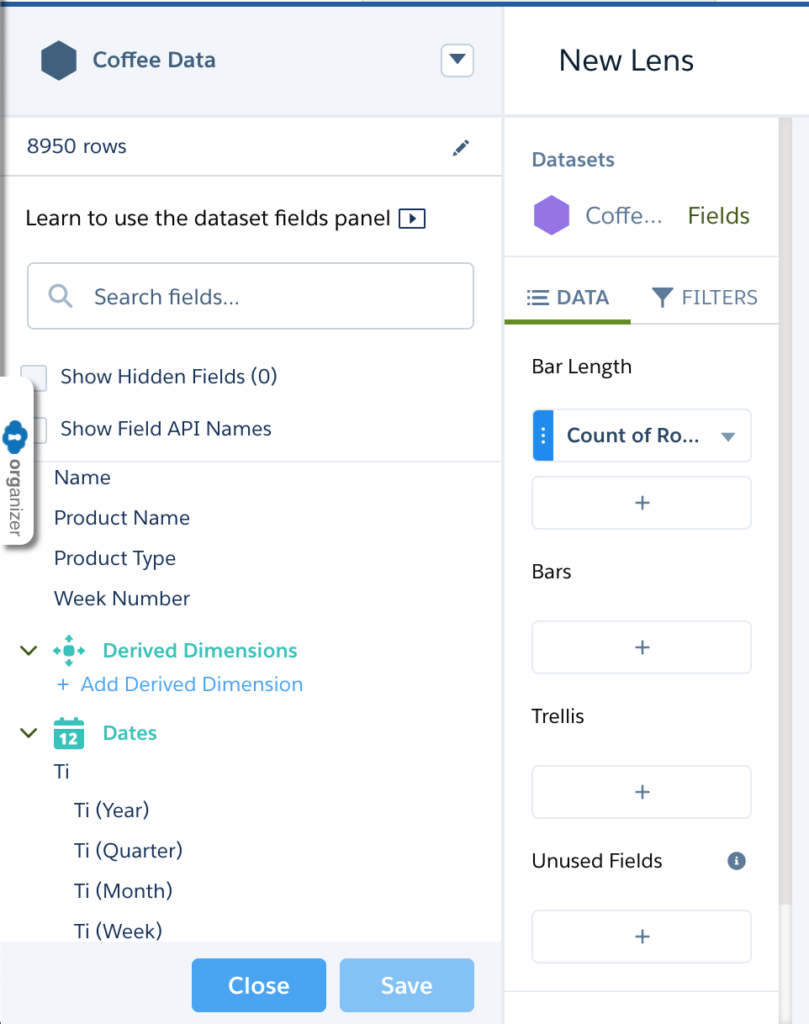
}As a last step, let’s open the newly created dataset by double clicking on the dataset (or using the “Explore” action). Ignore the chart for now and just click on “Field” to bring up the Dataset XMD editor. There’s at least one column that could do with a human readable name, and that’s “Ti”. Let’s call it “DateTime” by clicking on the name, entering a more readable label and then hit return and click the save button. Now we’re set for the first analysis – stay tuned!